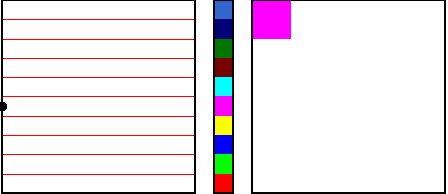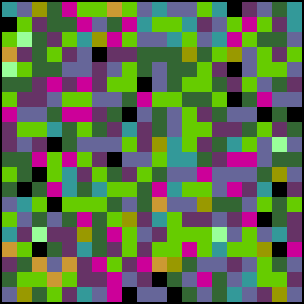
The Kelly plot is a data representation method inspired by some of the paintings of Ellsworth Kelly. By the method of coarse-graining, a sequence of data values is converted into a sequence of numbers, and each number is assigned a color. Now construct an approximately square array of small squares, one for each data point. Left-to-right, top-to-bottom, each small square is painted the color of the numbers, read in the order they were assigned by the data.
 |
| Click the picture for an animation illustrating this process. |
Here are some Kelly plots generated by the tent and logistic maps.
Here are some more examples.
|
|||||
 |
|||||
| A normal random sequence (more values around the middle than near the outliers) |