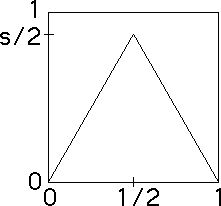
The Tent Map is one of the simplest nonlinear functions. It consists of two linear functions:
| T(x) = s*x | for x <= 1/2 |
| T(x) = s*(1-x) | for x >= 1/2 |
For small x, the Tent Map represents growth; for larger x decline, perhaps an effect of competition for limited resources.
 |
Note the maximum value occurs at
We shall see the graph should stay inside the unit square. Consequently, we restrict the number s to the range,/P.
0 <= s <= 2.
We shall see that as s varies, the structure of the orbit x0, x1 = T(x0), x2 = T(x1), ... varies in a very complicated way, but not as complicated as that of the logistic map.
Nevertheless, the iterates of the tent map exhibit rich behavior, including chaos.
Return to Test Functions.