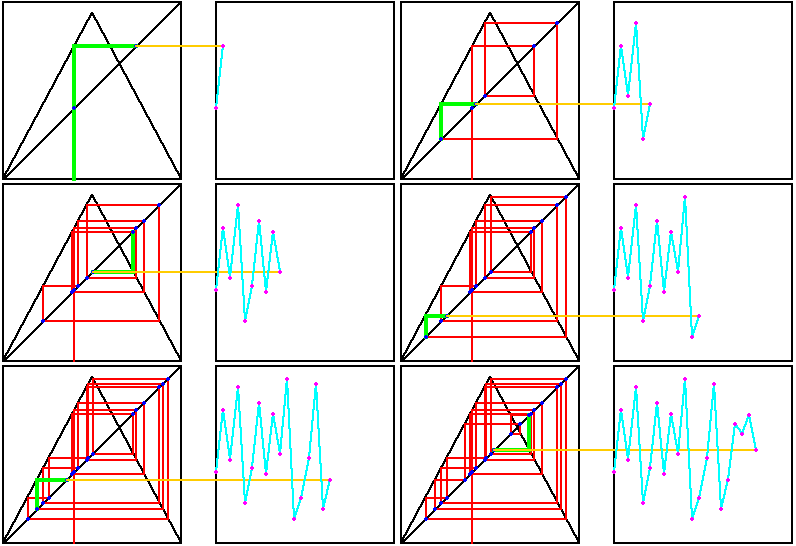
A time series plot of a sequence x0, x1, x2, x3, ... consits of plotting the points
Some kinds of time patterns are easily visible with such plots; others are not. Nevertheless, this is the standard representation of EKG, EEG, financial, seismological, and many other kinds of data.
 |
| Click on the picture to stop the animation. |
To illustrate the sorts of things we can learn from a time series, here are some time series generated by Tent Maps for some different s values.
Return to Deterministic Chaos.