| s=0.7 |
| s=1.5 |
| s=2.0 |
| s=2.5 |
| s=3.1 |
| s=3.5 |
| s=3.6 |
| s=3.826 |
| s=3.85 |
| s=3.9 |
| s=4.0 |
 |
 |
The logistic map and the tent map are really families of functions: both depend on a parameter s. For each s, we get a different function. The values of the iterates of a point certainly can depend on s, and the bifurcation diagram is a method of organizing this data.
Specifically, the bifurcation diagram is a graph of the s-values on the horizontal axis, and above each s-value the iterates of some value, plotted vertically.
To emphasize the long-range behavior, sometimes the points are plotted only after a number of transients are computed but not plotted.
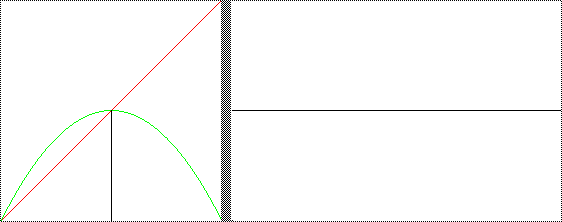
Selecting the s-values on the left, we see the bifurcation diagram for s up to that value, together with the graphical iteration plot and histogram at that s-value.
|
|
Return to Deterministic Chaos.