Deterministic Chaos
6.D.3. Histograms of Orbits
Following the graphical iteration
path, we see some
of the paths appear to run over the same lines. Often, this is the effect of the nonzero
width of pixels. Near enough numerical values can fall in the same pixel.
To keep track
of this, we plot the histogram of the iterates.
Divide the
vertical unit interval into some number of bins, one bin per pixel.
Then every time an xi lands in a bin, we increment the counter of the number of points that have
landed in that bin.
Visually, we represent this by plotting another pixel to the right.

|
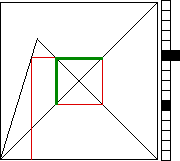
| Click the picture to see the first few steps in constructing
a histogram. |
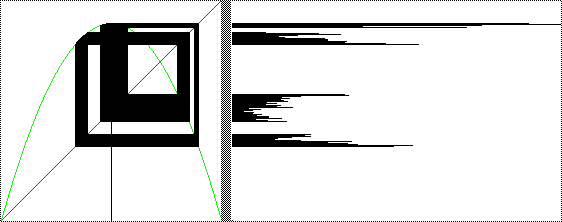
Here are some examples for the
logistic map L(x) = s*x*(1 - x). The
vertical gray band
separates the graphical iteration plot from the
histogram.
|
|
 |
| s = 3.58 The histogram appears to consist of four islands consisting of about the same
number of pixels (taking into account the length of the hsitogram lines). So in some sense, we could think of
this as a noisy 4-cycle. Probably the orbit is chaotic, restricted to these four
bands. However, by examining the histograms alone, we cannot be sure we aren't looking at a 16384-cycle, for
example. Histograms can tell some things, but not all things. |
|
Return to Deterministic Chaos.

