The Chaos Hypertextbook™
© 1995-2003 by Glenn Elert
All Rights Reserved -- Fair Use Encouraged
Bifurcation diagrams rendered with 1-D Chaos Explorer
As was shown in the diagrams, subregions within the bifurcation diagram look remarkably similar to each other and to the diagram as a whole. This self-similarity was shown to repeat itself at ever finer resolutions. Such behavior is characteristic of geometric entities called fractals (a topic I will address in later chapters) and is quite common in iterated mappings. In the period-doubling region, for instance, the whole region beginning at the first bifurcation "L1" [lambda one] looks the same as either region beginning at the second bifurcation "L2" [lambda two] which looks the same as either region beginning at the third bifurcation "L3" [lambda three], and so on. Interestingly enough, the distance between successive bifurcation points "Ln" [lambda n] shrinks geometrically in such a fashion that the ratio of the intervals
![]() [delta]
[delta]
approaches a constant value as "n" approaches infinity. This constant, called Feigenbaum's number, crops up repeatedly in self-similar figures and has an approximate value of
| 4. 669201609102990671853203820466201617258185577475768632745651 343004134330211314737138689744023948013817165984855189815134 408627142027932522312442988890890859944935463236713411532481 714219947455644365823793202009561058330575458617652222070385 410646749494284981453391726200568755665952339875603825637225 (Pickover 249) |
Not only does Feigenbaum's constant reappear in other figures, but so do many other characteristics of the bifurcation diagram. In fact, remarkably similar diagrams can be generated from any smooth, one-dimensional, non-monotonic function when mapped on to itself. A circle, ellipse, sine, or any other function with a local maximum will produce a bifurcation diagram with period-doublings who's ratios approach "d" [delta]. Together with a second constant "a" [alpha], the scaling factor "d" [delta] demonstrates a universality previously unknown in mathematics: metrical universality. The behavior of the quadratic map is typical for many dynamical systems. One year after their discovery, the period-doubling route to chaos and the constants "a" [alpha] and "d" [delta] appeared in an unruly mess of equations used to describe hydrodynamic flow. This might not be so amazing if it weren't for the fact that Feigenbaum's constants were originally derived from a mathematical model of animal populations. In the segmented, fragmented world of modern science hydrodynamicists and population biologist rarely interact with one another. The realization that a set of five coupled differential equations describing turbulence could exhibit the same fundamental behavior as the one-dimensional map of the parabola on to itself was one of the key events in the history of mathematics.
This chapter has been devoted to the exploration of the simple one-dimensional iterative mapping
f: x --> x2 + c
where "x" and "c" were real numbers. The statement was made that the behavior of this system is typical for "any smooth, one-dimensional, non-monotonic function when mapped on to itself." Many books on chaos mention how Feigenbaum's constants and the period-doubling route to chaos appear in other one-dimensional mappings, but few provide examples. Thus, I felt it necessary to explore the behavior of additional functions to see if such results were really universal. The results were rather interesting and quite unexpected. Let's look at the bifurcation diagrams for some other mappings.
Bifurcation Diagram
f: x --> c sin x
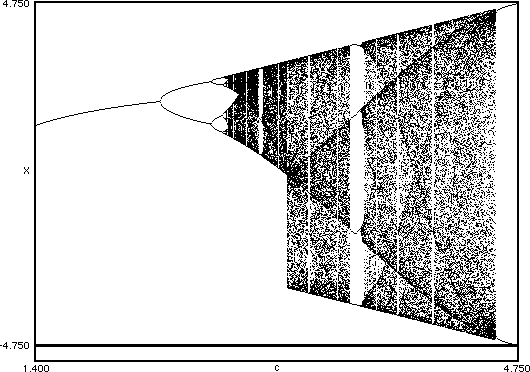
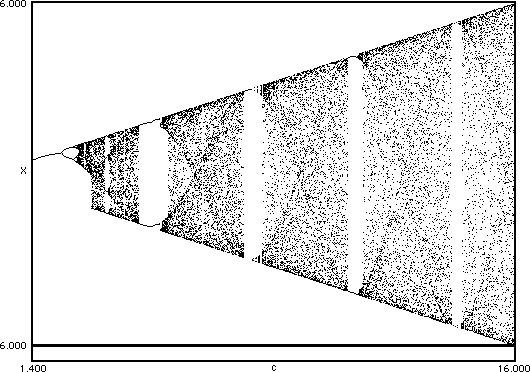
The structure of the bifurcation diagram is similar to that of f: x --> x2 + c with a period-doubling path to chaos and an ergodic region with odd-period windows. In the quadratic case, the bifurcation diagram was finite and ended at a parameter value beyond which all orbits escaped to infinity. In the sinusoidal case, however, the map continues with an abrupt bump in the chaotic regime. This region is punctuated with even-period windows; the most prominent being a four-cycle. The chaotic regime widens and then terminates on a two-cycle, each side of which bifurcates. Again, the ergodic region bumps out and the pattern repeats itself ad infinitum as shown below.
Bifurcation Diagram on a Larger Interval
f: x --> c sin x
As a variation on a theme, I tried the mapping f: x --> sin x + c. This is more like the quadratic mapping in that the parameter raises and lowers the function without changing its shape. As expected, the orbits gave a bifurcation diagram nearly identical to that for the quadratic map, but with a bit of a twist.
Bifurcation Diagram
f: x --> sin (pi x) + c
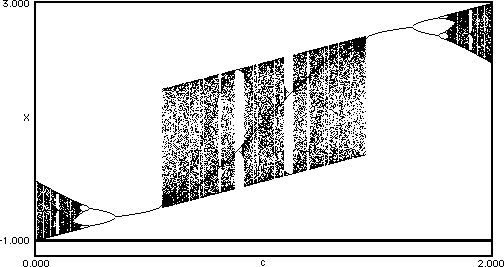
Again, we see an abrupt change from behavior characteristic of the quadratic map to a broad ergodic region. As with the previous sinusoidal map, this extra ergodic region has windows of even periodicity. (Note how the largest windows are open on one side.) This region ends with another quadratic-like bifurcation diagram rotated 180° from the first. The behavior of the diagram on the interval [2, 4] is identical to that on [0, 2] only shifted two units higher. Thus, the interval [0, 2] is characteristic of the remainder of the parameter values and can be used as a unit cell. The full diagram runs diagonally through the origin across the parameter space from negative infinity to positive infinity
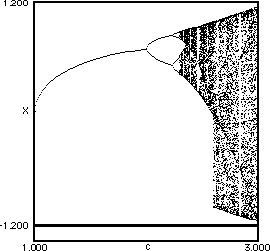
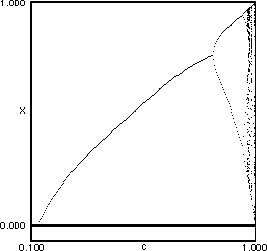
Some more mundane bifurcation diagrams are shown below. All functions are smooth and non-monotonic. Note that each one undergoes a period-doubling route to chaos and that there are always windows of odd periodicity within the chaotic regime.
 |
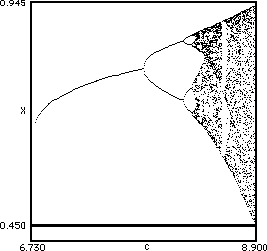 |
| x --> cx (1 - x2) | x --> cx3 (1 - x) |
 |
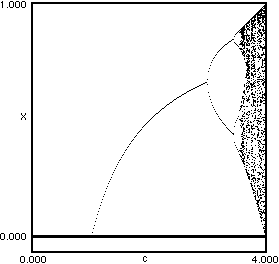 |
| x --> c (1 - (2x - 1)4) | x --> cx (1 - x) |
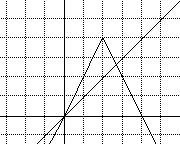 How about a non-monotonic function that is
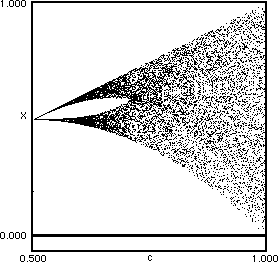
not smooth? The function f: x --> c (1 - 2 abs(x - 1/2))
is called the tent function for obvious
reasons. For parameter values in the interval [0, 1/2] all well-behaved
orbits collapse to zero while parameters greater than one drive all orbits
to infinity. The first diagram below shows the orbits over the range [1/2, 1]
where the behavior can be called "interesting". While there is
a superficial similarity to many of the previous mappings (the two ergodic
"arms" merging into one for example) this one does not exhibit
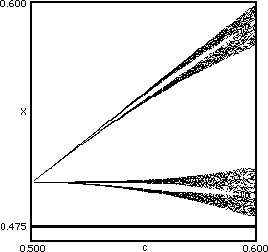
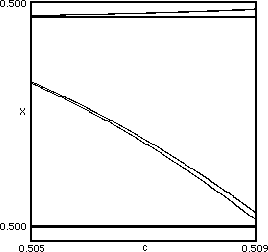
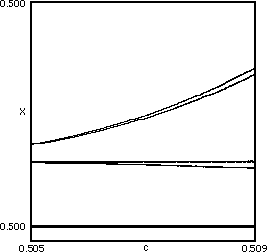
period-doubling or windows. What look like single lines turn out to be,
on closer examination, pairs of lines. When these are examined in more detail,
they also turn out to be pairs of lines and so on. Orbits in the non-ergodic
regions are not periodic but tend to cluster together and thus appear to
have even periodicity. There is no bifurcation with this map. Those orbits
that are neither stable nor ergodic most likely form a Cantor
set. I have yet to find any mention of the surprisingly odd behavior
of this map in the popular literature. How about a non-monotonic function that is
not smooth? The function f: x --> c (1 - 2 abs(x - 1/2))
is called the tent function for obvious
reasons. For parameter values in the interval [0, 1/2] all well-behaved
orbits collapse to zero while parameters greater than one drive all orbits
to infinity. The first diagram below shows the orbits over the range [1/2, 1]
where the behavior can be called "interesting". While there is
a superficial similarity to many of the previous mappings (the two ergodic
"arms" merging into one for example) this one does not exhibit
period-doubling or windows. What look like single lines turn out to be,
on closer examination, pairs of lines. When these are examined in more detail,
they also turn out to be pairs of lines and so on. Orbits in the non-ergodic
regions are not periodic but tend to cluster together and thus appear to
have even periodicity. There is no bifurcation with this map. Those orbits
that are neither stable nor ergodic most likely form a Cantor
set. I have yet to find any mention of the surprisingly odd behavior
of this map in the popular literature. |
 |
 |
 |
 |
| Another quality webpage by Glenn Elert |
 |
home | contact bent | chaos | eworld | facts | physics |